Shelter Animal Outcomes
Background
Every year, approximately 7.6 million companion animals end up in US shelters. Many animals are given up as unwanted by their owners, while others are picked up after getting lost or taken out of cruelty situations. Many of these animals find forever families to take them home, but just as many are not so lucky. 1 million dogs and cats are euthanized in the US every year.
The number of dogs and cats euthanized in U.S. shelters annually has declined from approximately 2.6 million in 2011. This decline can be partially explained by an increase in the percentage of animals adopted and an increase in the number of stray animals successfully returned to their owners.
Objectives
The goal of this project is to predict the probability that an animal would be adopted, euthanized, transferred, or returned back to the original owner based on animal’s basic information, such as age, breed and gender.
Current Practices
Australia uses several strategies to reduce the Euthanasia of shelter animals. The strategies include government policies, practices and attitudes of animal shelter staff. Examples of the policies include fines if animals are found wandering outside of the owner’s property; public course offering such as Responsible Dog Ownership Course.
Exploratory Data Analysis
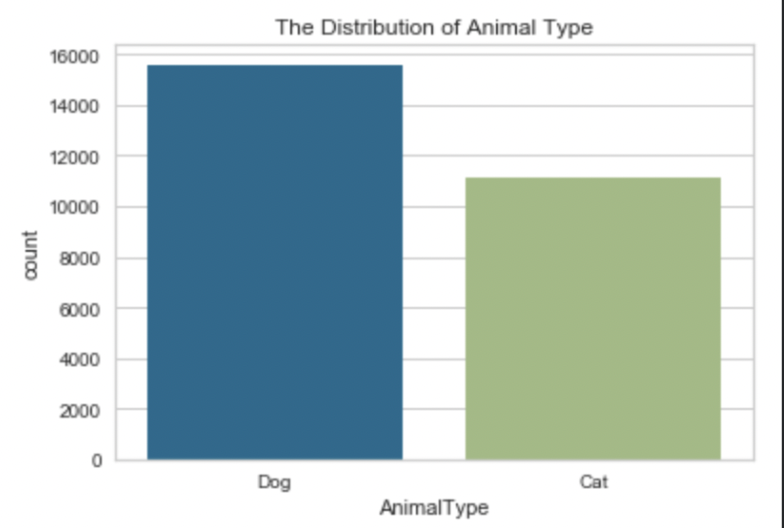
This distribution shows the general dataset I am working with and shows the total amount of dog and cat pictures that are used for this project. There are slightly more dogs than cats in the data.
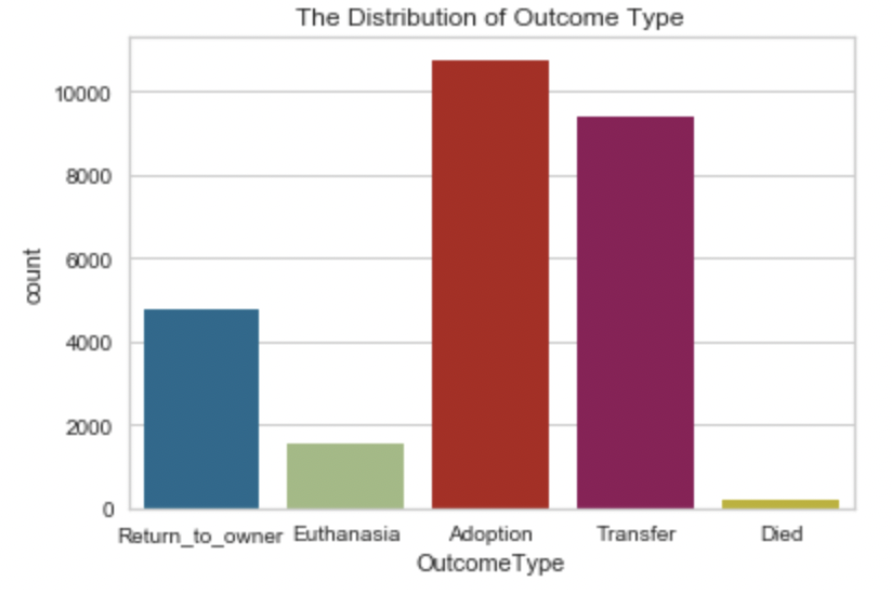
This distribution shows the total amount of animals that were returned to the owner, euthanized, adopted, transferred, or died. The two common outcomes are Adoption and Transfer.
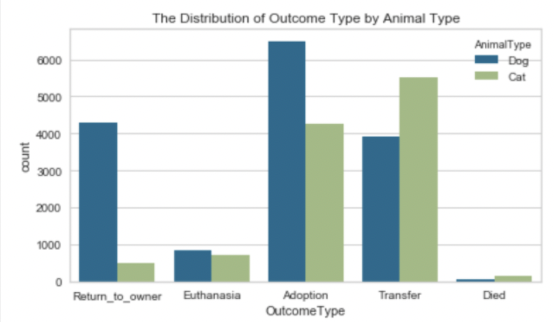
This distribution showcases each outcome that either the dog or cat had, and compares both statistics side by side. The dogs are more likely to return to owner or get adopted.
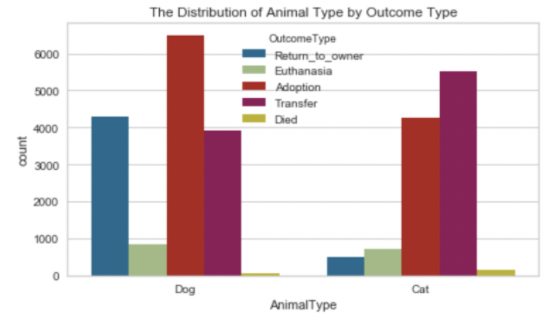
This distribution categorizes the data on the left with all of the categories for dog and all of the categories for cat combined. Cats are more likely to be transferred.
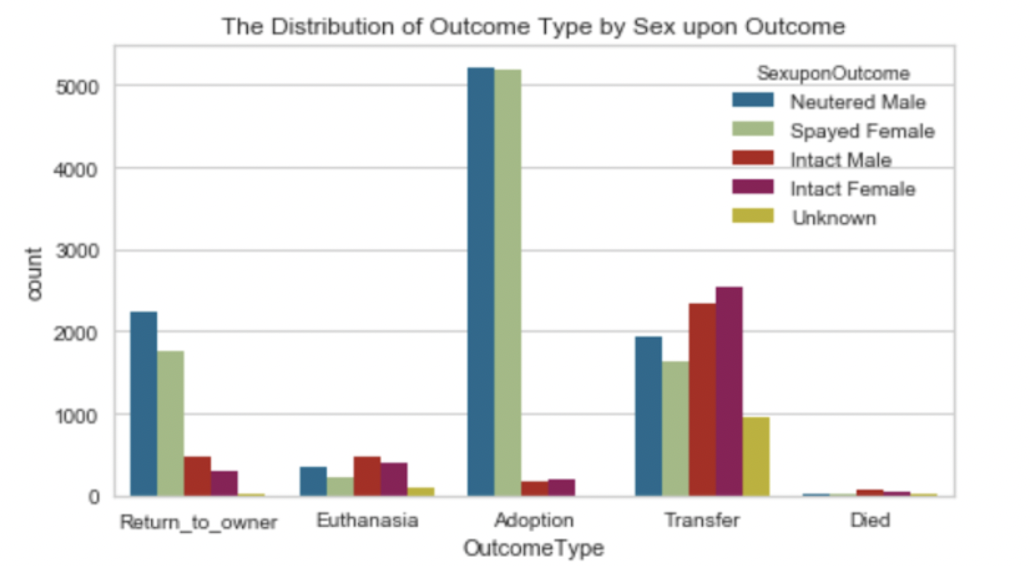
This distribution shows the genders for each outcome of the dogs or cats. Neutered Male and Spayed Female are more likely to be adopted.
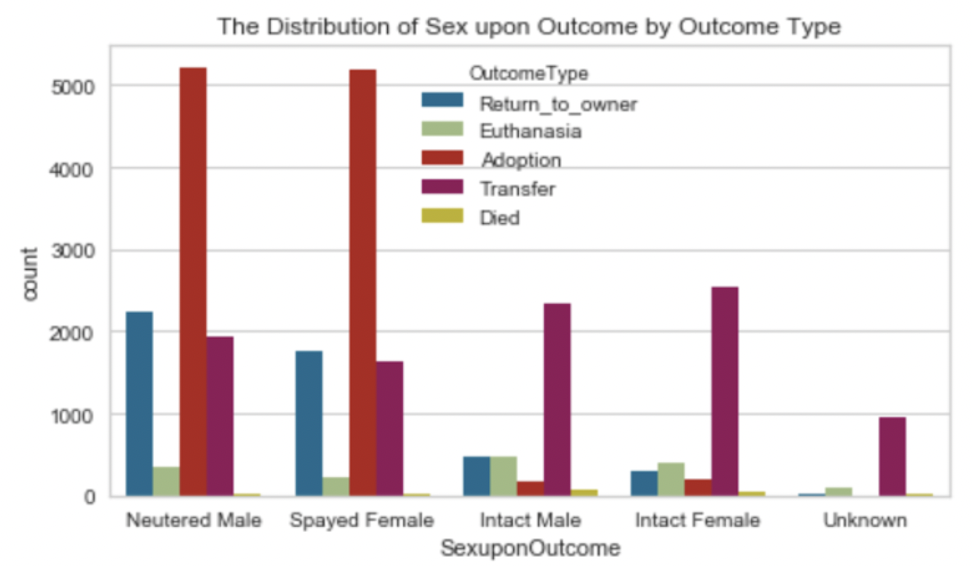
This distribution flips the categories from the distribution on the left and instead shows each outcome type for each gender. Transfer is more common among Intact Male, Intact Female and Unknown.
Overview of the dataset
Using a dataset of intake information including breed, color, sex, and age from the Austin Animal Center, we can understand trends in animal outcomes. These insights could help shelters focus their energy on specific animals who need a little extra help finding a new home. 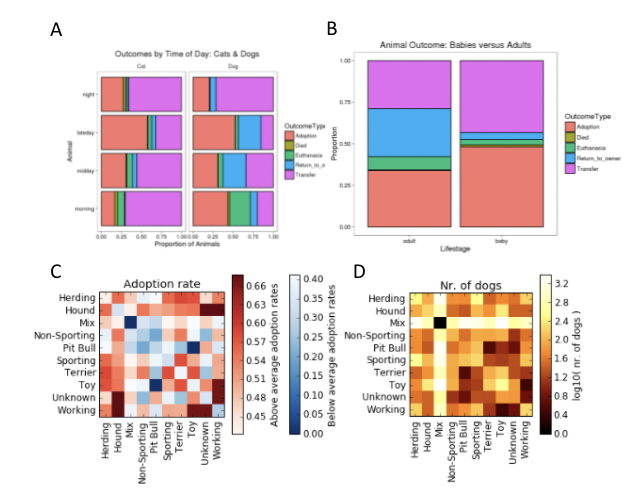
Figure 1: Overview of the Dataset
A. The faith of animals in the shelter are recorded for both cat and dog by time of day. They either get adopted, die, euthanized, returned to owner, or transferred to another shelter. For both cats and dogs, the adoption rate is higher in late day.
B. The faith of animals by their life stage. Babies get adopted more often.
C. X and Y axes shows different breeds, and each square represent mixes of the two breeds in X and Y. This plot describes the adoption rate for the different combinations of mixed breed dogs. In the heatmap, blue represents below average and red represents above average in adoption rate.
D. Number of dogs by the breed in logarithmic scale. The dataset is highly imbalanced by the breed. Weighted model by the class sample size is recommended.
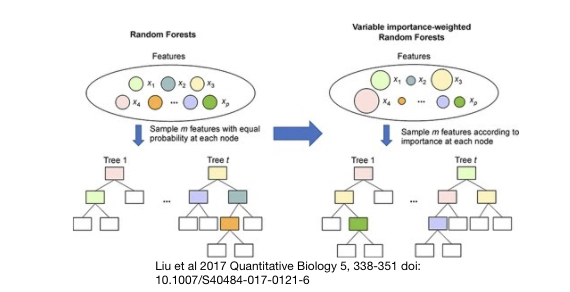
Figure 2: Building Weighted Random Forest Model
I built a random forest model weighted by the correlation of each variables to the outcome. The variables include Age, Intact, Time of day, Color, Name, Animal type, Sex, Mixed breed. 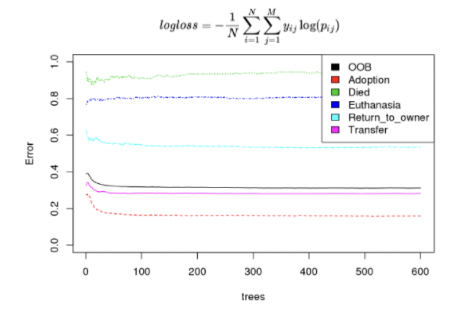
Figure 3: Model Evaluation
The loss function of the model is the multi-class logarithmic loss. where N is the number of animals in the test set, M is the number of outcomes; y is 1 if observation is in outcome and 0 otherwise, and p is the predicted probability that observation i belongs to outcome j. As shown in the plot, the training score is much higher than the cross validation score which indicates there is overfitting. When overfitting, we can use less complicated model to resolve the issue.
Model Interpretation 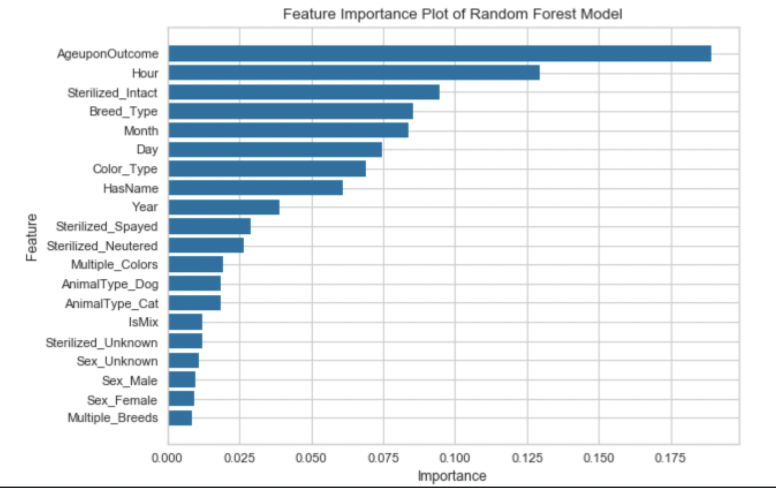
The top features are Age upon Outcome, Hour, Sterilized Intact, Breed Type and Month.
What does it do?
The predictive model suggests which animal would likely to get adopted or euthanized. The model would help the animal shelters to understand what features of the animal affects their chance. The shelters can put their resources to improve certain aspects of the animals.
How do I evaluate the project’s success?
With the implementation of the model, I would receive feedbacks from the animal shelter staffs and those who adopted the animals that are treated with the suggestions of my tool. Ask them if those suggested features affected their decision to adopt the animal.
What did I learn from this project.
I learned how many animals truly go through this horrific process and how much the care they receive from animal shelters could change their faith. In certain regions, the rate of euthanasia is high due to overcrowding in shelters. To reduce the rate of euthanasia, we can get started from understanding how we can treat the animals in the shelter to improve their chance of getting adopted. This project helped me to understand how parameter tuning works. Even with the same training data and test data, the test accuracy changed based on how many trees, depths of the tree, and node sizes there were.
What’s next for this project?
I would like to package this predictive model as a user-friendly tool and distribute to animal shelters. The staffs can use this tool during registration process for the new animal to receive suggestions on what the shelter could do to improve the chances of this animal get adopted, or at least avoid getting euthanized since the early stage of their stay at the shelter. 
Early intervention begins at the registration process of animal shelter to improve their chance to get adopted
